Welcome to the CCRP GIS Support Newsletter! We will use this blog as a tool for communicating with you and your fellow researchers about how mapping and analysis can be used to facilitate your research, analyze your results, and present your findings. Each newsletter will focus on a specific topic and use concrete examples to illustrate a data source, methodology, cartographic approach, or some other aspect of GIS. Newsletters will be published one to two times per month and we will notify researchers via email when a new edition is available.
CHIRPS Precipitation Data
There is a wealth of climate and precipitation data available for the three African CCRP regions. One data set that looks particularly useful is
CHIRPS (Climate Hazards Group InfraRed Precipitation with Station data) produced by the Climate Hazards Group at the University of California Santa Barbara.
 |
| Data in Real Time: The most recent pentad showing precipitation for all of Africa |
CHIRPS is a 30+ year quasi-global rainfall dataset that blends data from ground-based observation stations and satellite data. The data has a global spatial resolution of 0.05 x 0.05, and daily data are avaiable for Africa at a resolution of 0.25 x 0.25 degrees. Data can be downloaded in daily, pentad, dekad, monthly, 2-monthly, 3-monthly, and annual time steps. Data can be downloaded in three formats: .tif, .bil, and .netcdf.
The data can be used in a variety of ways:
- Comparing long-term historic averages with the current season
- Generating year-over-year comparisons of precipitation
- Deriving statistics such as areal averages, totals, and max values within a given area
- Calculating the probability of drought based on historic data
- Creating isohyets for your research area and surrounding region
- In addition to the spatial aspect of CHIRPS data, the precipitation information can be used to generate site characterizations and other tabular data
We have downloaded and prepared CHIRPS data for all three CCRP regions: West Africa, East and Horn of Africa, and Southern Africa. Data are available on the TerraGIS server, and we are in the process of building tools to make them available for download.
Please contact us directly if you are interested in using CHIRPS data in your research.
Below are examples of how other researchers have used CHIRPS data within the CCRP regions (excerpted from USGS/USAID publications available
here):
 |
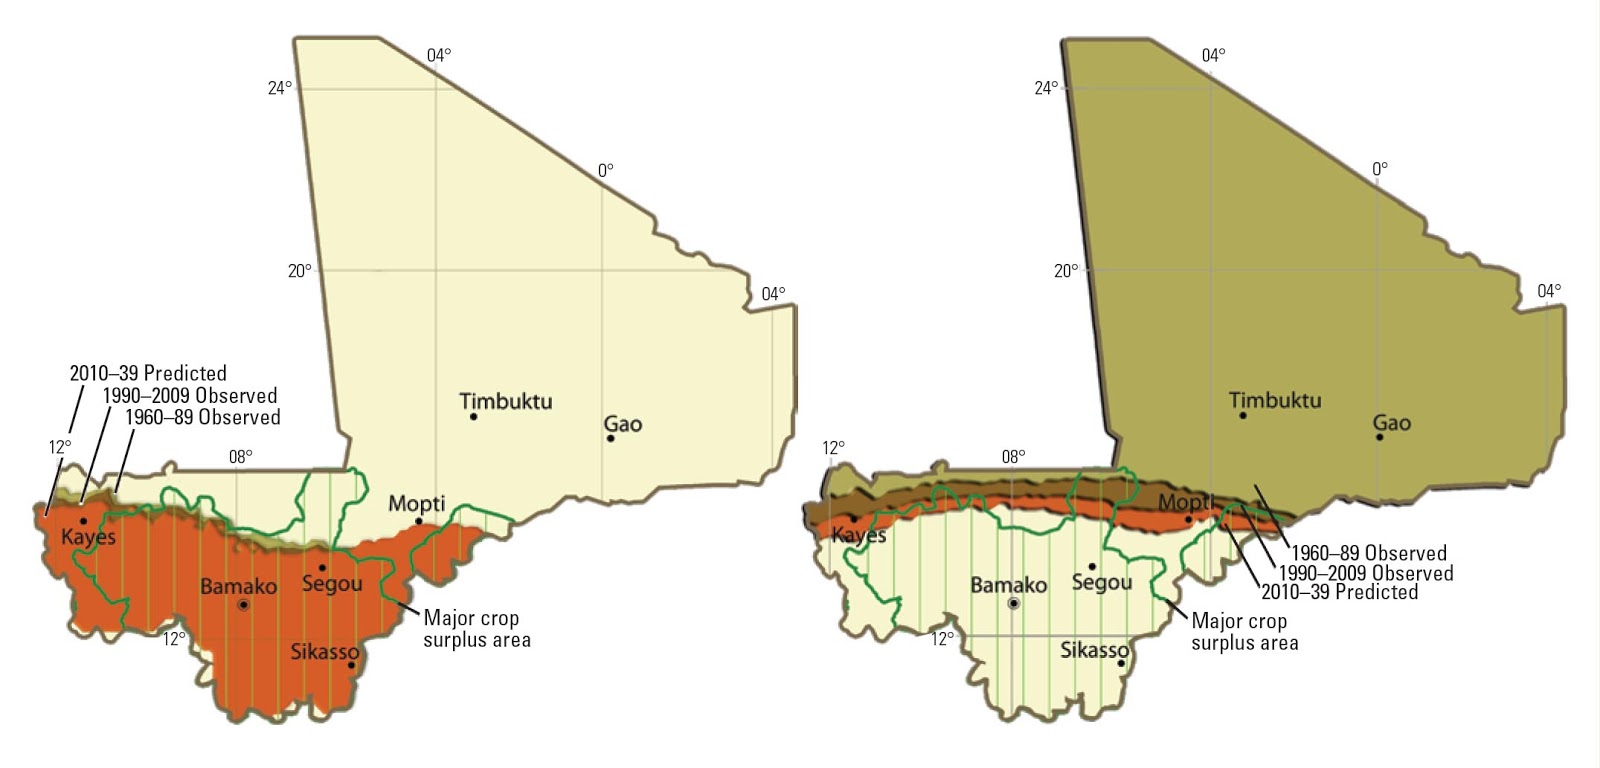
| Climate change in Mali: The left map shows the average location of the June–September 500-millimeter rainfall isohyets for 1960–1989 (light brown), 1990–2009 (dark brown), and 2010–2039 (predicted, orange). The green polygons in the foreground show the main crop surplus regions for millet and maize. The right map shows analogous changes for the June–September 30°Celsius air temperature isotherms |
 |
| Rainfall and Temperature Changes in Uganda: Observed (1960–2009) and projected (2010–2039) changes in March–June and June–September rainfall and temperature. |
 |
| Climate change in Ethiopia (Funk and others, in press): A shows the average location of the March–June 500 mm rainfall isohyets for 1960–1989 (light brown), 1990–2009 (dark brown), and 2010–2039 (predicted, orange). B shows the average location of the June–September 500 mm rainfall isohyets. C shows the average location of the March–September 900 mm rainfall isohyets. D shows the average location of the March–June 250 mm rainfall isohyets. The semi-transparent purple overlay shows the areas with 2007 population densities of greater than 100 people per km2. The yellow shading in the background delineates agricultural areas; the gray background delineates agro-pastoral and pastoral livelihood areas (cf. fig. 1B). |
The CHIRPS team is currently working on developing a similar dataset for temperature, and we will be sure to notify you when that data becomes available, hopefully in the near future.